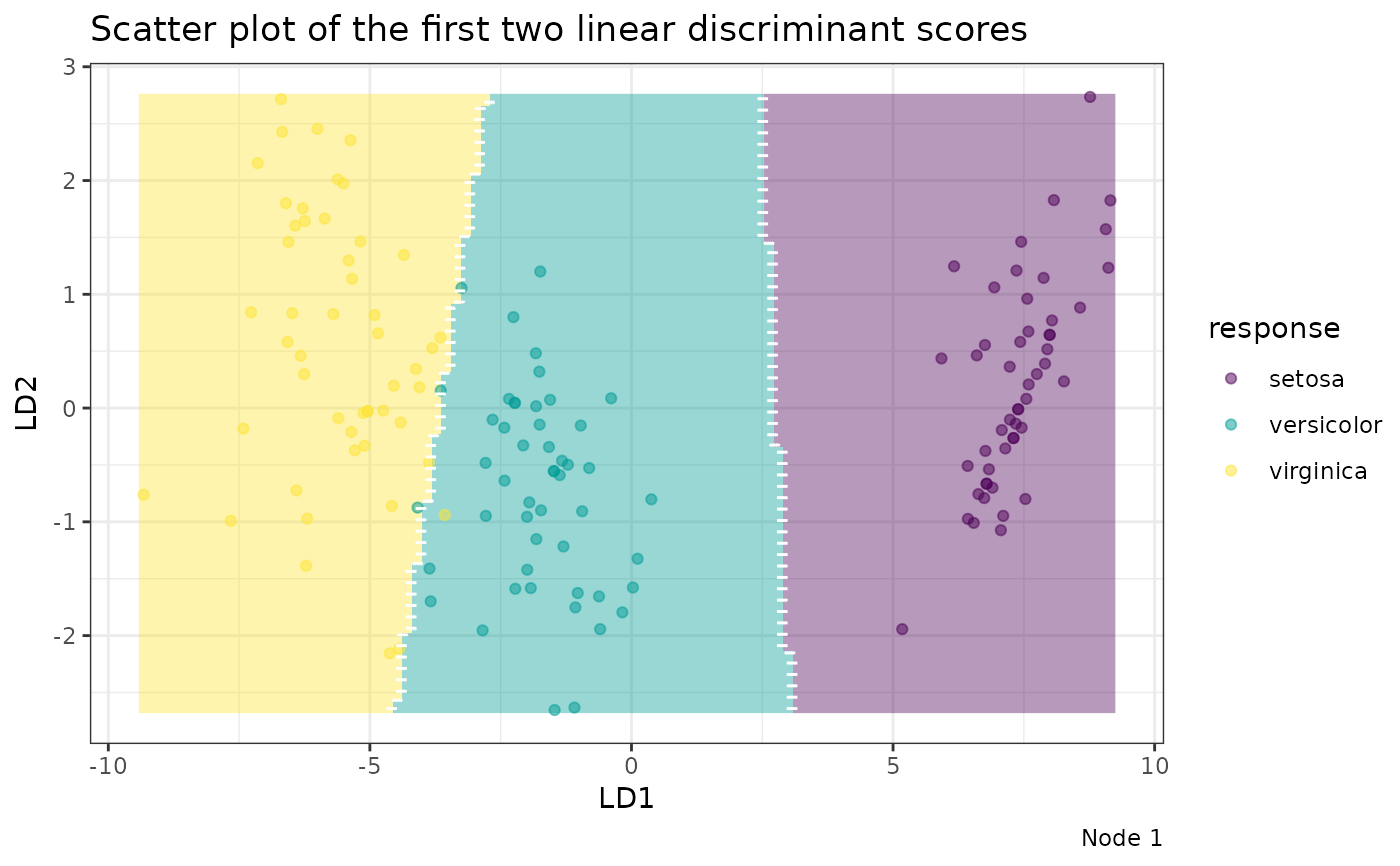
This function visualizes either the entire decision tree or a specific node
within the tree. The tree is displayed as an interactive network of nodes and
edges, while individual nodes are scatter/density plots using ggplot2.
Usage
# S3 method for class 'Treee'
plot(x, datX, response, node = -1, ...)
Arguments
- x
A fitted model object of class
Treee, typically the result of theTreee()function.- datX
A data frame of predictor variables. Required for plotting individual nodes.
- response
A vector of response values. Required for plotting individual nodes.
- node
An integer specifying the node to plot. If
node = -1, the entire tree is plotted. Default is-1.- ...
Additional arguments passed to the plotting functions.
Value
A visNetwork interactive plot of the decision tree if node = -1,
or a ggplot2 object if a specific node is plotted.
Overall Tree Structure
A full tree diagram is displayed using visNetwork when node is not
specified (the default is -1). The color represents the most common
(plurality) class within each node, and the size of each terminal node
reflects its relative sample size. Below each node, the fraction of
correctly predicted training samples and the total sample size for that
node are shown, along with the node index. Clicking on a node opens an
information panel with additional details.
Individual Node Plot
To plot a specific node, you must provide the node index along with the
original training predictors (datX) and responses (response). A scatter
plot is generated if more than one discriminant score is available,
otherwise, a density plot is created. Samples are projected onto their
linear discriminant score(s).

