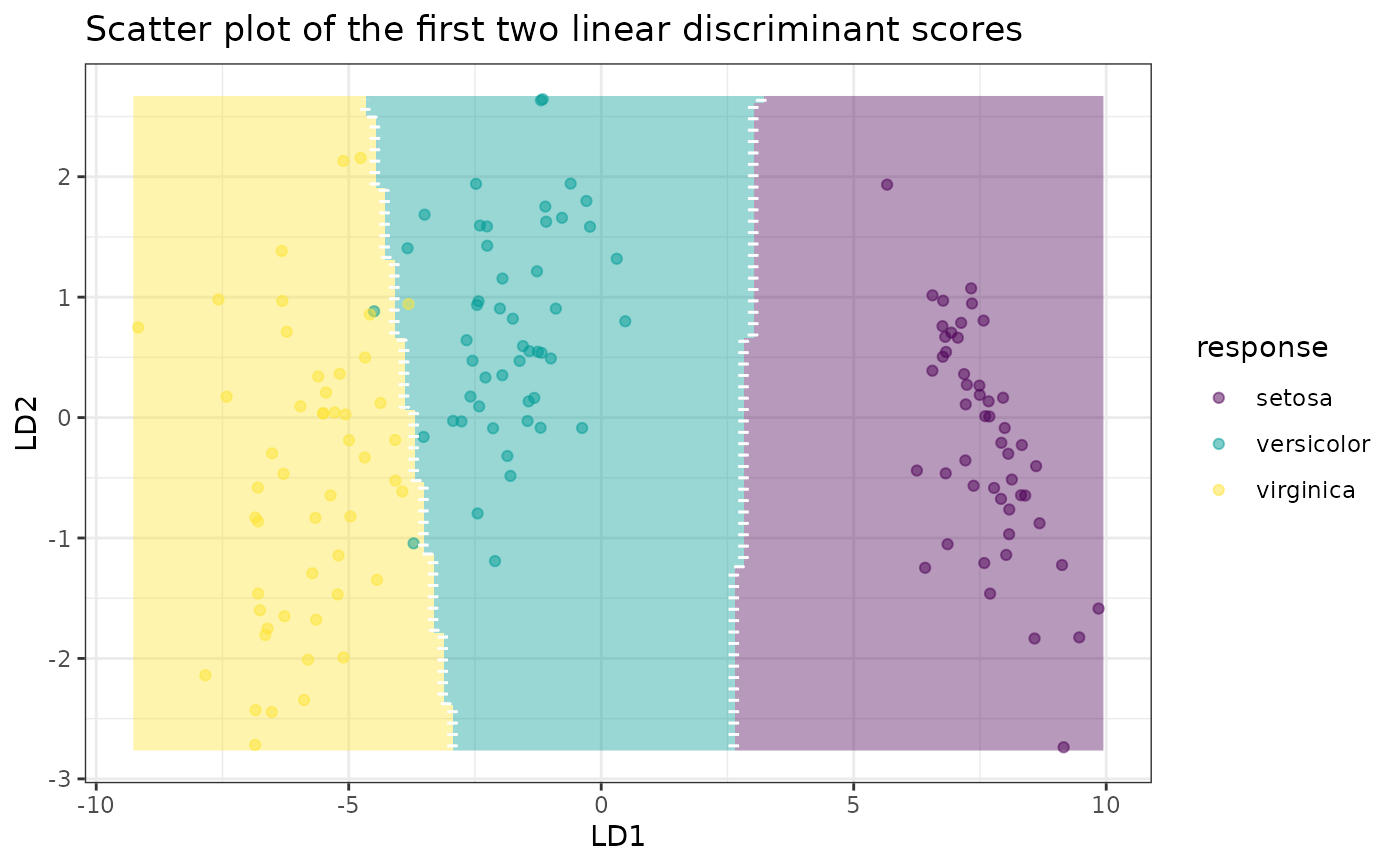
This function plots the decision boundaries and linear discriminant (LD)
scores for a given ULDA model. If it is a binary classification problem, a
density plot is created. Otherwise, a scatter plot with decision boundaries
is generated.
Usage
# S3 method for class 'ULDA'
plot(x, datX, response, ...)
Arguments
- x
A fitted ULDA model object.
- datX
A data frame containing the predictor variables.
- response
A factor representing the response variable (training labels)
corresponding to datX.
- ...
Additional arguments.
Value
A ggplot2 plot object, either a density plot or a scatter plot with
decision boundaries.
Examples
fit <- folda(datX = iris[, -5], response = iris[, 5], subsetMethod = "all")
plot(fit, iris[, -5], iris[, 5])